Debugging, traces & UI mode
Break things, debug them and analyze with the trace viewer.
You recorded your first tests in the previous lesson but recorded code is rarely the code you ship. Selectors break, pages take time to render, the network does something unexpected. Before we write any more tests, let's learn how to figure out why a test failed.
Playwright offers multiple debugging tools: UI mode for live development, --debug for terminal step-through, the VS Code extension for breakpoint debugging, and traces (which I like to call "time-travel snapshots") for runs that already happened (CI failures, a co-worker's machine, last night's nightly run).
UI mode — this is the way
For years the community begged for a "watch mode" from the Playwright team. It never came. Instead we got something much better — UI mode.
$ npx playwright test --ui
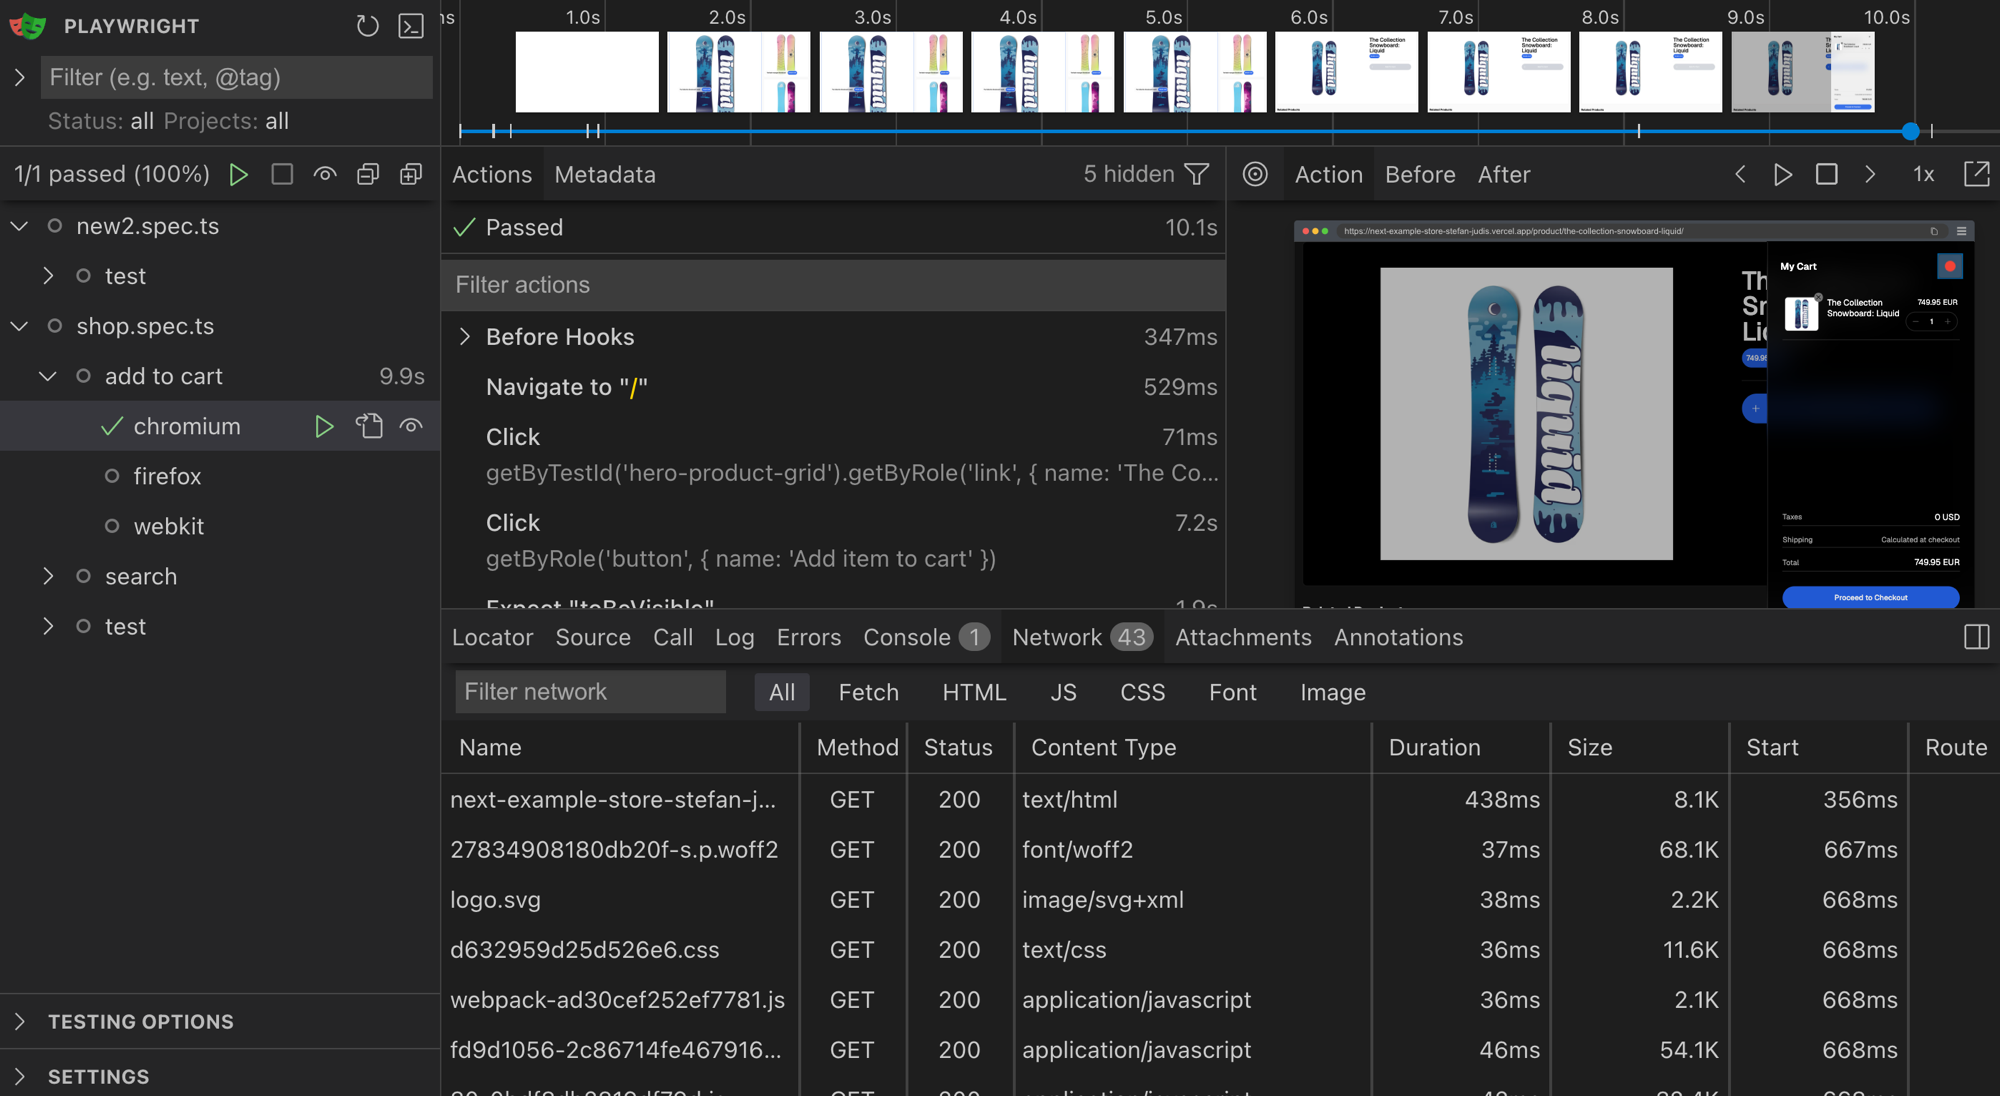
Inside UI mode you get, all in one window:
- Watch mode — tests re-run on every file save
- DOM snapshots — hover over any step to time-travel into the page
- Network waterfall — every request the test made
- Console + errors panel — did the page throw? You'll see it
- Locator picker — point-and-click to generate a robust locator
- Trace Viewer built in — pause on any step and scrub
Open it. Live in it. You'll thank yourself once the tests start failing.
You can also combine --ui with --headed which is my preferred way of using
UI mode.
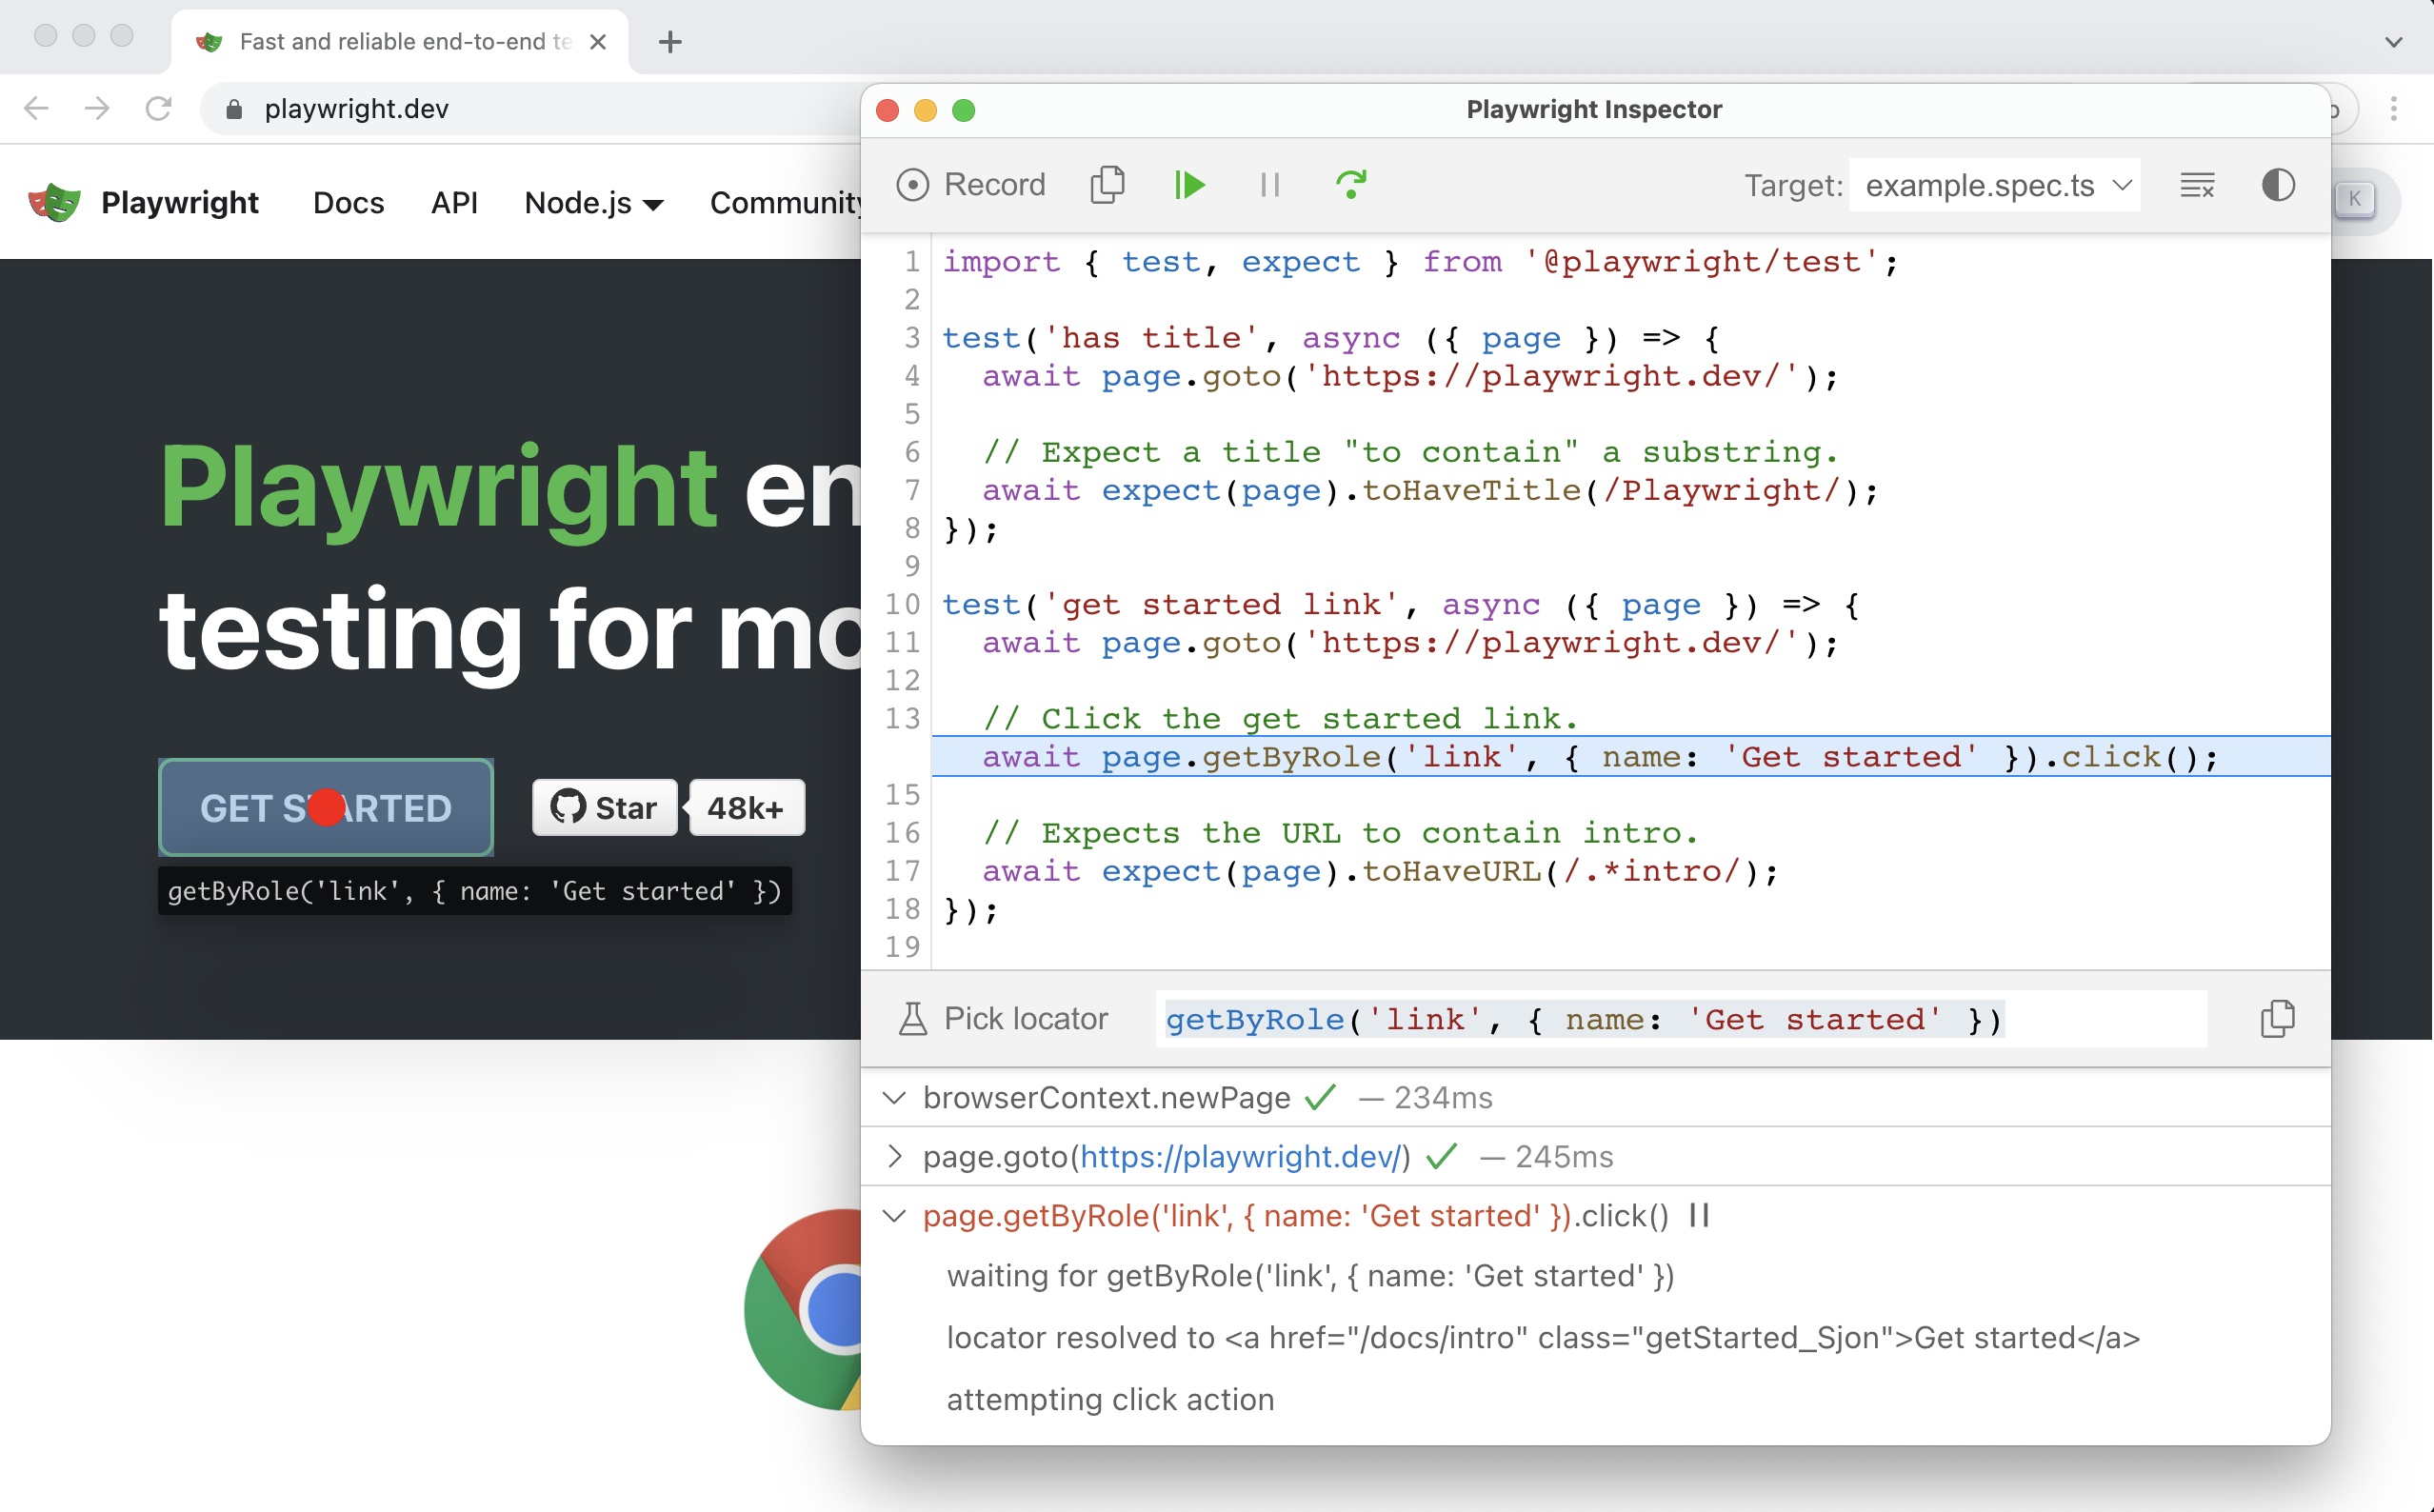
Debugging via the Playwright inspector
Using --debug
Sometimes you just want to step through a test. Quick and easy. The --debug flag opens the Playwright Inspector and pauses on every action.
$ npx playwright test --debug
$ npx playwright test tests/shop.spec.ts --debug
Check all available test options via npx playwright test --help.
To only run a single test in one file from the command line, leverage
test.only.
Using page.pause
If you run your Playwright tests in --headed mode you can also set a custom "breakpoint" by using page.pause().
test.only("search", async ({ page }) => {
  await page.goto("https://www.playwright-workshop.online/");
  await page.pause();
  // ...
});
page.pause() will open the inspector when the breakpoint is reached.
Traces — time travel for CI failures
The debugger and UI mode are great while you're writing tests. But what about a run that failed in CI, on your colleague's machine, or in last night's nightly? You can't attach a debugger after the fact — but you can read a trace.
A trace is a snapshot recording of every action your test performed. It includes console messages, network information, full HTML snapshots of every step, screenshots, and much more.
By default Playwright doesn't collect traces locally (they're heavy). To learn what they're about, flip them on for every run in playwright.config.ts:
export default defineConfig({
  use: {
    trace: "on",
  },
  // ...
});
Now run your tests:
$ npx playwright test
trace: on writes now new trace.zip files for each test in your test-results/.
There are three good ways to open them.
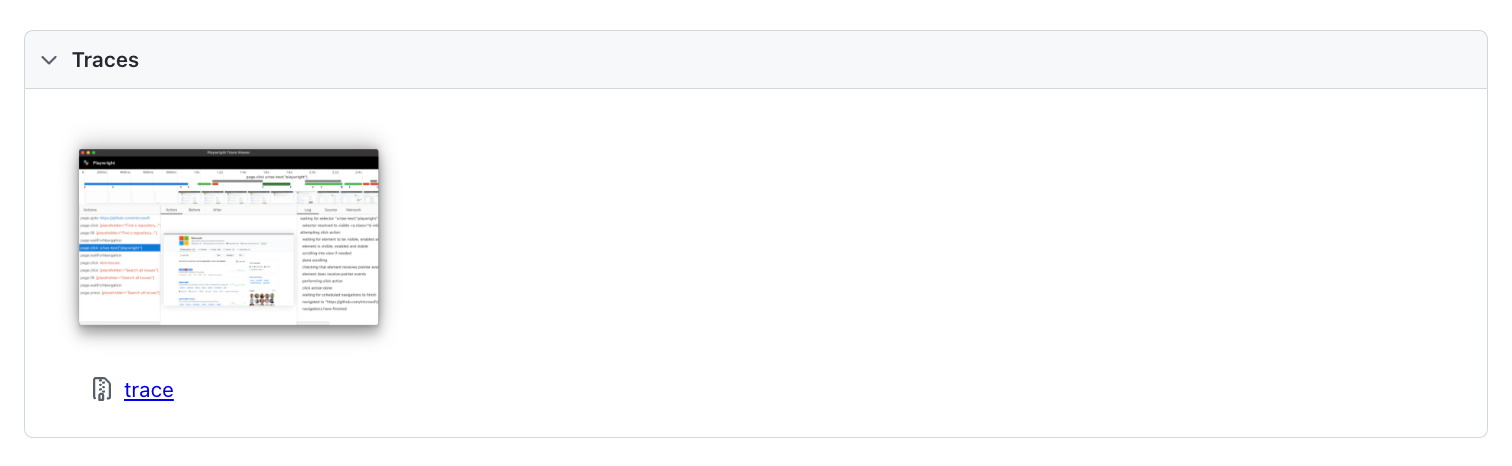
From the HTML report
Whenever a trace was recorded, the generated HTML report links to it.
From the command line
$ npx playwright show-trace test-results/example-has-title-chromium/trace.zip
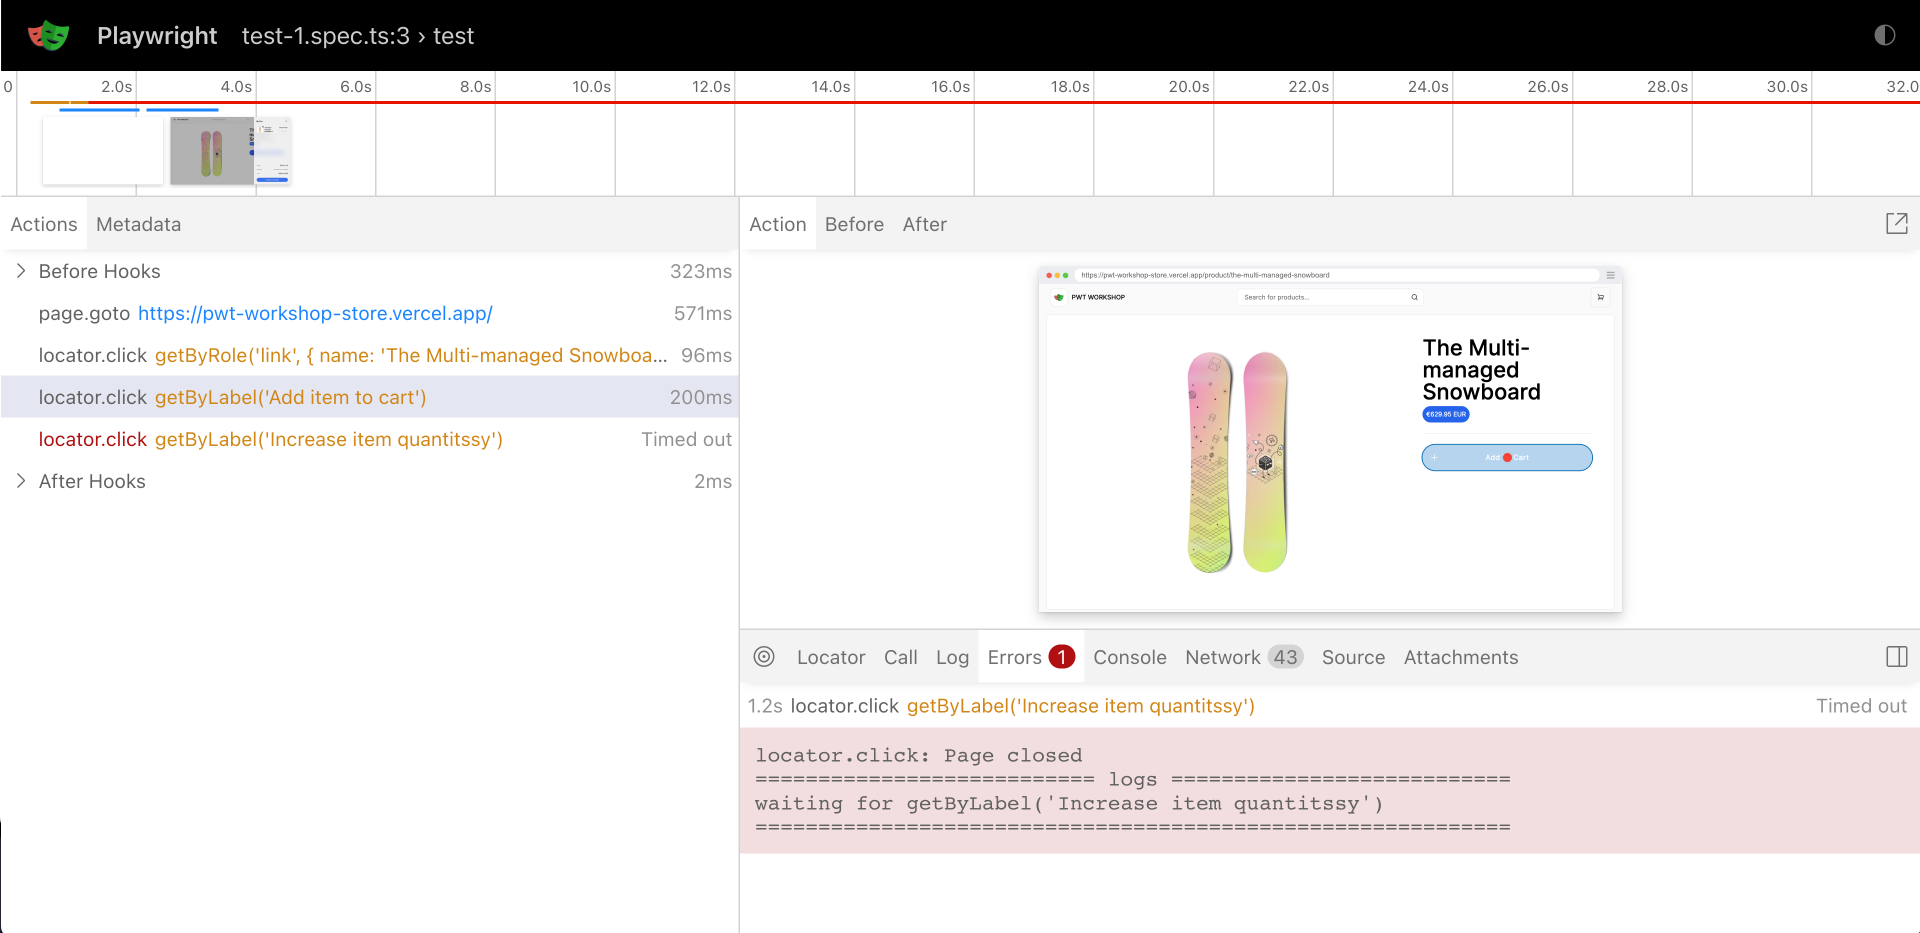
The trace viewer visualizes every test step, a timeline, and a full HTML snapshot of the page at that step. It's time-travel debugging for your end-to-end tests.
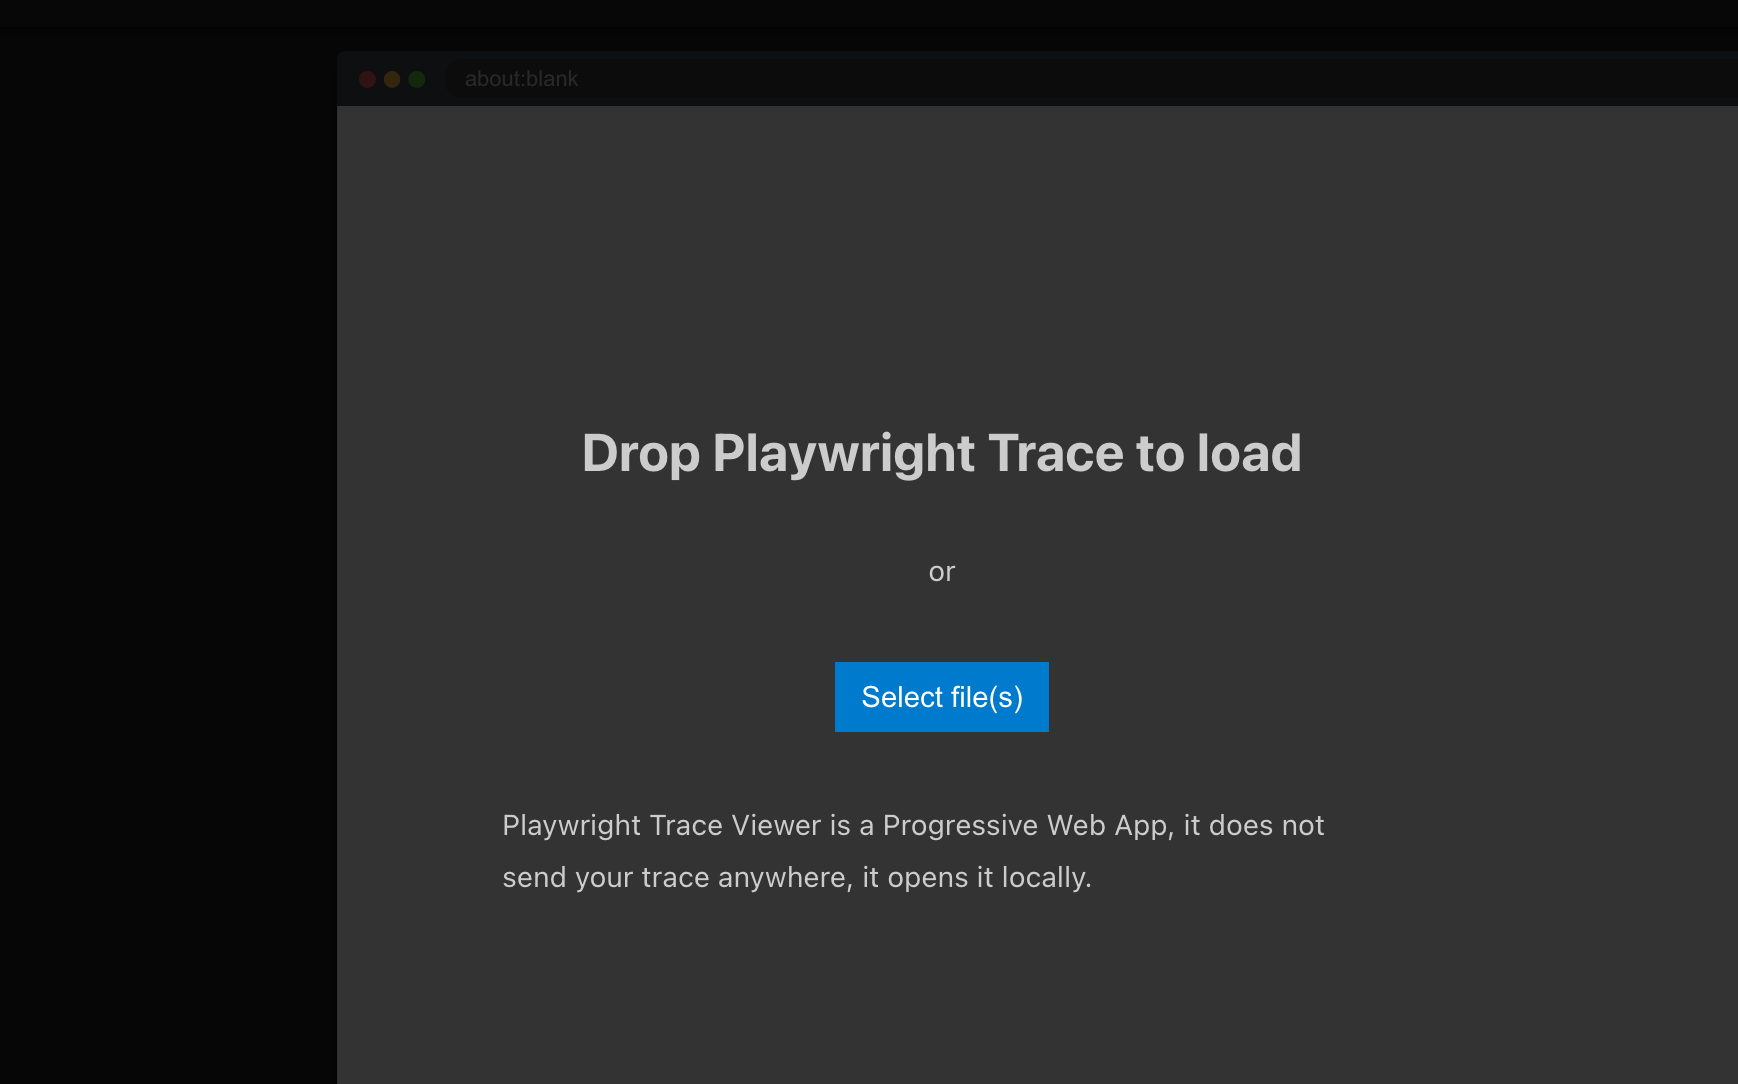
From the online viewer
You don't need Playwright installed at all to read a trace. Drag a trace.zip onto trace.playwright.dev and it opens in your browser.
In production you probably don't want trace: "on" (every run, every test
generates a zip). The defaults you'll most often reach for are
"on-first-retry" and "retain-on-failure" — collect traces only when
something actually went wrong.
Break it, then fix it
The fastest way to get fluent with the debugging tools is to break a working test on purpose and recover from it.
Fix the test
Here's a broken test. It includes multiple mistakes. Find out what's wrong and make it pass.
test("[broken] completes a full shopping journey from search to cart", async ({
  page,
}) => {
  await page.goto("https://www.playwright-workshop.online");

  await page.getByRole("link", { name: "Login" }).click();
  await page.getByLabel("Name").fill("stefan");
  await page.getByLabel("Your password").fill("12345678");
  await page.getByRole("button", { name: "Login" }).click();

  await page.waitForURL(/\/account/);

  await expect(page.getByTestId("login-name")).toBeVisible();

  await page.getByPlaceholder("Search for products...").fill("snowboard");
  await page.getByPlaceholder("Search for products...").press("Enter");
  await expect(page.getByTestId("search-item-grid")).toBeVisible();
  await page.getByRole("link", { name: "Price: Low too high" }).click();
  await expect(page).toHaveURL(/sort=asc/);
});
- Copy the test into your project.
- Debug it in your prefered way.
- Make it pass.
Analyze the trace
Here's a trace file from a previous CI/CD run. Try to understand why the test didn't pass.
- Open the trace file.
- Debug and understand what went wrong.